
PerfView
Analyze ETW and CLR data efficiently
Description
PerfView is a powerful diagnostic tool designed for developers and IT professionals to investigate performance issues. It enables deep analysis of Event Tracing for Windows (ETW) logs and CLR memory dumps, providing insights into CPU usage, memory allocation, and application behavior. With an intuitive interface, users can collect, view, and interpret data from ETL files and heap dumps, helping identify bottlenecks and optimize system performance. Ideal for troubleshooting in production or development environments, it simplifies complex data into actionable reports.
Screenshots
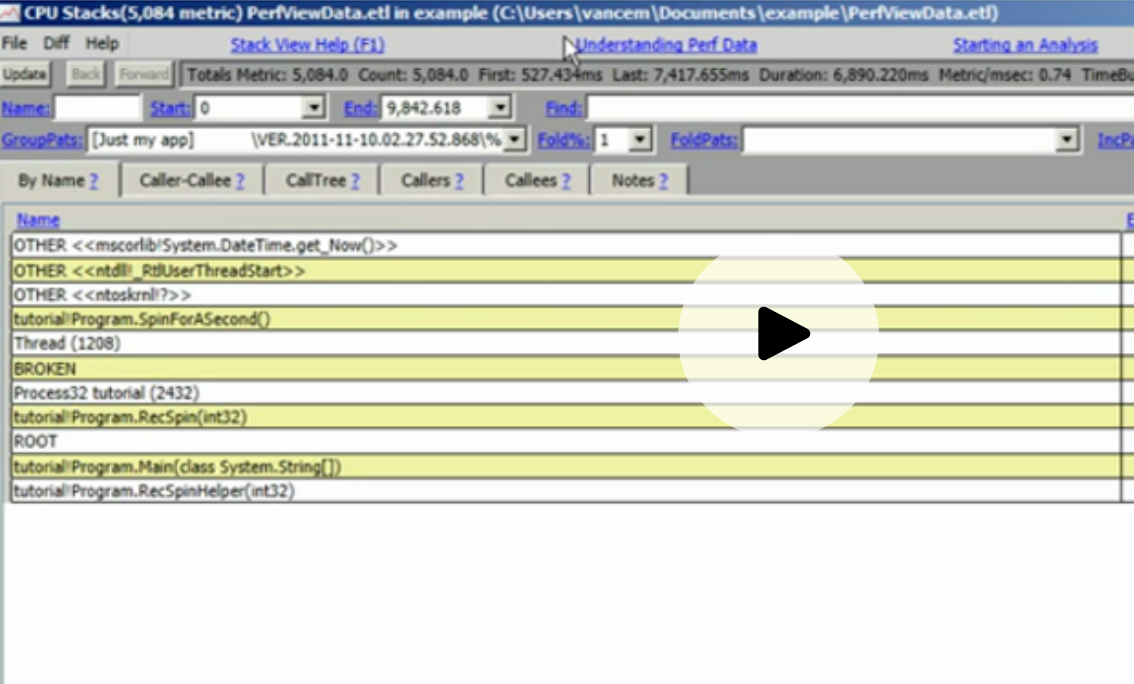
Click to view full size